
Media
media
-
![]()
Wipo Publishes Patent of Mulchandani Nanik Tirath for "The Energy Device" (Indian Inventor)
US Fed News Service. lncluding US State News
July 1. 2013GENEVA, July 1 -- Publication No. WO/ 2013/ 093935 was published on June 27.
Title of the invention: "THE ENERGY DEVICE."
Applicants: Mulchandani Nanik Tirath (IN).
Inventors: Mulchandani Nanik Tirath (IN).
According to the abstract *posted by the World Intellectual Property Organization: "The present invention provides an apparatus for producing mechanical movement and then converting the same into electrical energy through expansion and compression of a medium."
The patent was filed on Sept. 10, 2012 under Application No. PCT/IN2012/000601.
*For further information, including images, charts and tables, please visit:
http://www.wipo.int/patentscope/search/en/detail.jsf?docId=WO2013093935For any query with respect to this article or any other content requirement, please contact Editor at
htsyndication@hindustantimes.com
media
-
![]()
The Energy Device (TED) Invented by Nanik Mulchandani reported by Pooja Shah
in Technology / Electronics (submitted 2014-03-22)
The effects of global warming and a rapidly growing population have impacted depletion of fossil fuels and increased the greenhouse effect. In the last century, there has been a substantial increase in fuel consumption which has led to an increase in the demand of energy all over the world. Nanik Mulchandani has invented and patented an unique energy device which has the ability to generate clean power, whilst also having the ability to effectively be harnessed as a source of mechanical energy for urban and rural transportation.
Addressing common bottlenecks faced by the clean energy industry including scalability, high cost per megawatt, intermittent power supply and difficulties with maintenance; Nanik Mulchandani has taken efforts to develop a green energy device which does not depend on conventional energy sources like sun, water and wind which are existing major options for green power generation.
Nanik Tirath Mulchandani has therefore presented a device related with the apparatus and its mode of operation which can be directly embodied on a vehicle or otherwise for generating power. The object of his invention is to provide energy which may operate without using fossil fuels. His device is a simple design which reduces construction and maintenance costs while successfully meeting generation needs. Nanik Mulchandani(TM)s patented device is in fact, a powerful method of generating electricity through the expansion and contraction of a fluid.
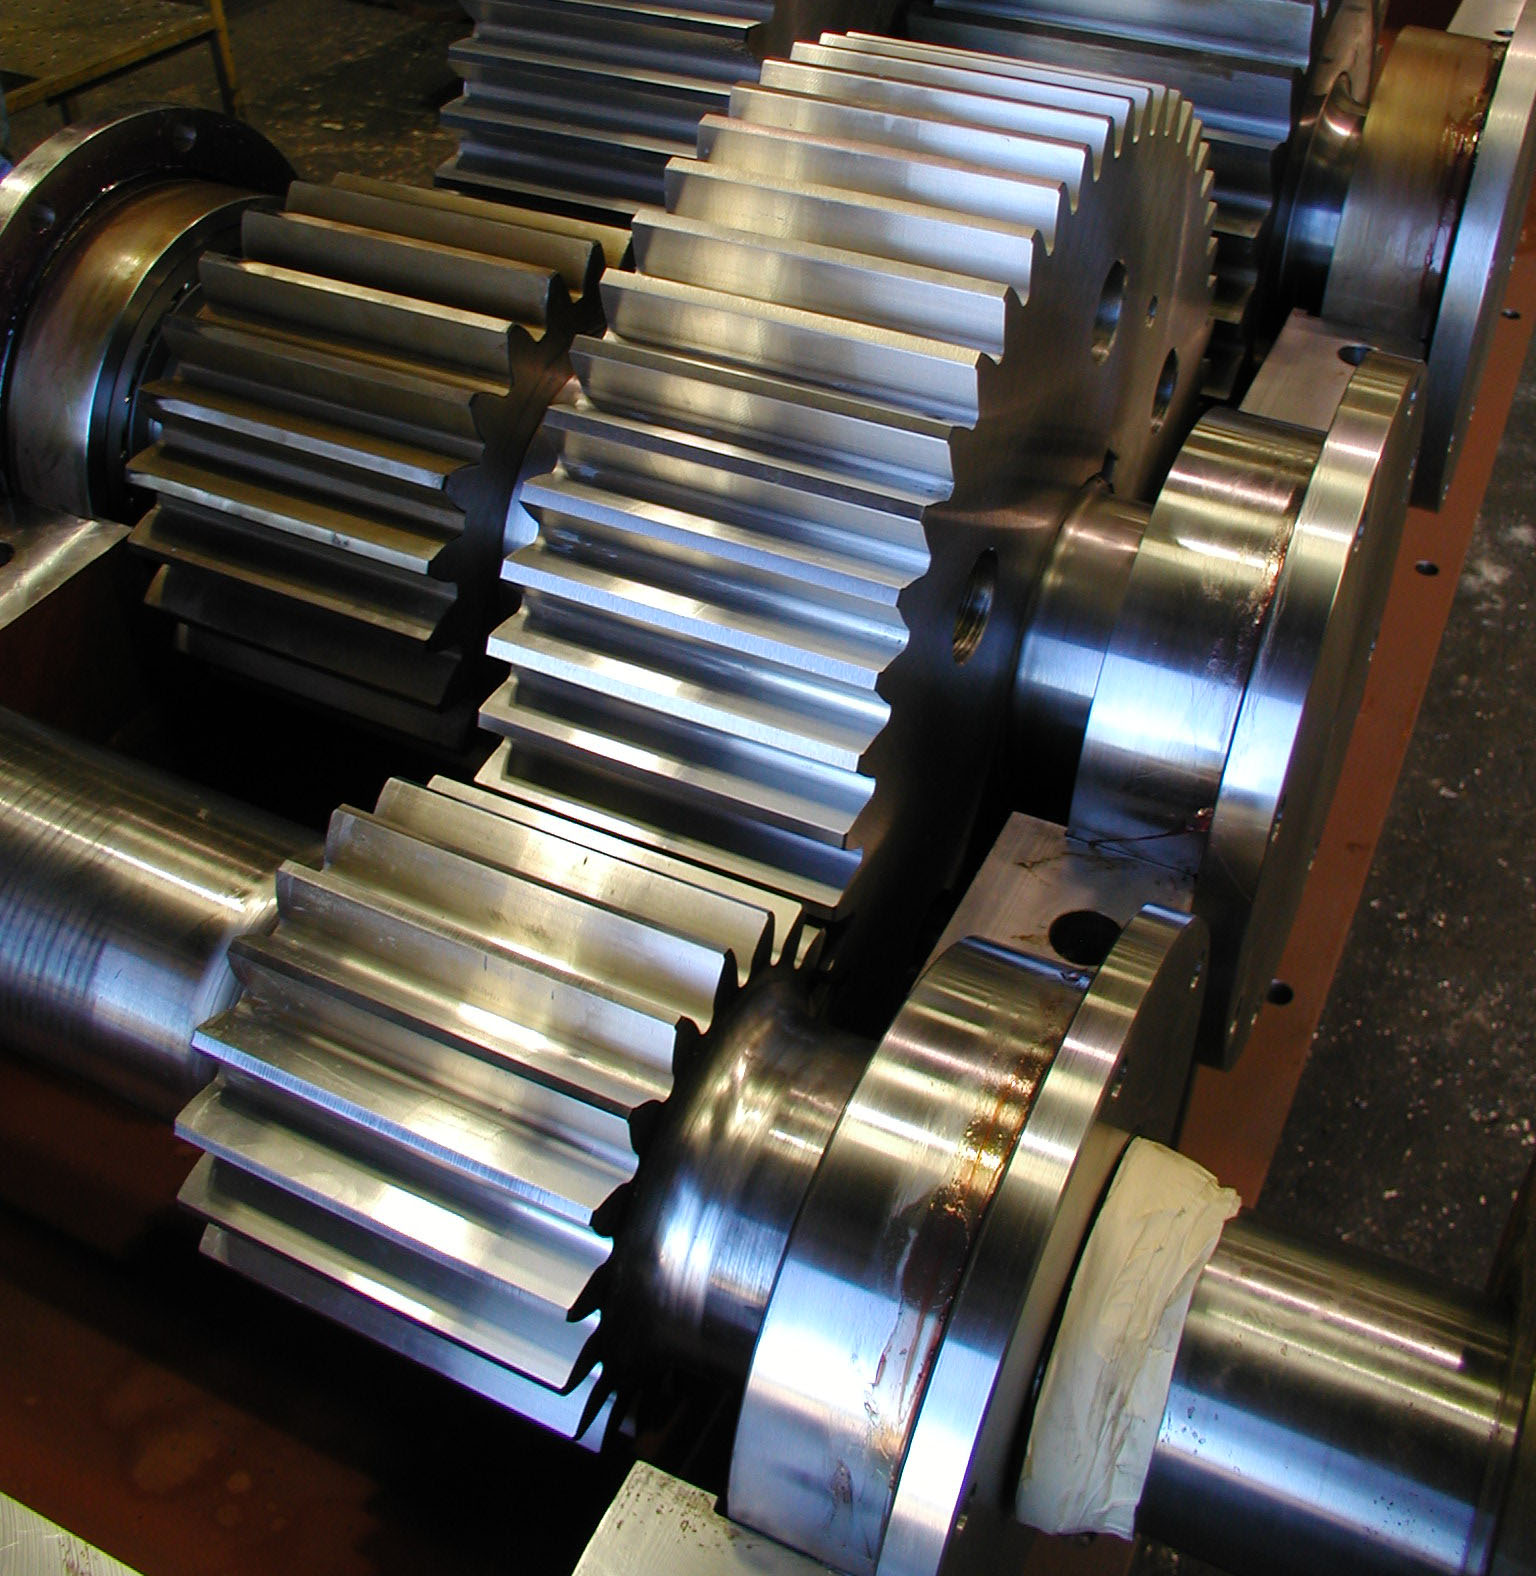
His device comprises of cylindrical chambers, heat capsule, piston, crankshaft, gear box and electrical connector which are externally linked. The apparatus invented by Nanik Mulchandani includes a volumetric amplifier connected to a patented cylindrical container filled with liquid mercury. This amplifier is connected to a specific gear box and externally connected to an electrical generator. A heat capsule connected to the mercury mover receives heat energy from an external source which subsequently causes a change in temperature of such mercury mover.
In addition, Nanik Mulchandani(TM)s apparatus also has the capacity to display changes in temperature, which is indicated by indications on the heat supply from the heat capsule, and decreases in temperature by a cooling effect with water sprays. When heat is received by the capsule, mercury, which is capable of transforming into fluid at 25 Celsius, occupies a greater volume. The effective volume available within the mercury mover being fixed, results in the movement of a piston.
This resultant movement marks the completion of a semi stroke and when connected to a volumetric amplifier, causes hydraulic fluid to flow to the hydraulic cylinder. Further passage of the hydraulic fluid from the outlet/inlet port of the amplifier, results in the piston getting retracted back into said mercury mover chamber which responds to a cooling action of such arrangement. The completion of a stroke, where the piston moves away from the mercury mover chamber in response to the expansion of mercury, is followed by a return stroke wherein the said piston moves towards the mercury mover chamber.
In response to the full stroke, the hydraulic fluid from a secondary hydraulic cylinder flows back into the volumetric expansion chamber through the corresponding outlet/ inlet ports of a secondary hydraulic cylinder.
This process of repeated full strokes results in a repetition of piston movements of the hydraulic cylinder and/or the volumetric amplifier. The eventual rotary movement of a crankshaft connected with a gearbox causes a step-up/step-down of the shaft speed depending on the requirements of an electrical generator.
The output of the gearbox is transferred to the flywheel connected to an electrical generator with the help of a gear arrangement which meshes the output gear of the gearbox and an external gear on the flywheel shaft. The rotation of the external gear results in the rotation of flywheel shaft and thus the flywheel. The flywheel shaft being connected with said electrical generator, results in rotation of the rotor of the electric generator and hence electrical energy is generated.
Volume of mercury is thus enhanced due to absorption of heat energy supplied through the heater. Furthermore, embedded heater is programmed to maintain the heat levels of the mercury, which is injected to the mercury mover. The heating and cooling mechanism of mercury is accordingly carried out in the mercury mover. The mercury mover maintains liquid mercury at required pressure levels, and mercury in the cylindrical chamber is prevented from leaking from the cylinder through a seal with rubber(TM) rings.
Nanik Mulchandani claims that his patented device for power generation will reduce the usage of fossil fuels, which could be saved for future generations and also, reduce the greenhouse effect.

media
-
![]()
Nanik Mulchandani Inventor of The Energy Device (TED)
Pressbox (Press Release) - A unique energy device invented by Nanik Mulchandani could be a huge initiative with reducing reliance on fossil fuels, in times when global warming has commenced. Added benefits are that "The Energy Device" (TED) does not depend on conventional energy sources like sun, water and wind which are existing options for green power generation--enabling consistency of output at a lower generation cost.
What is The Energy Device?
"The Energy Device” is related to patented technology for generating electrical energy through expansion and contraction of a fluid. To elaborate, a device producing perpetual mechanical movement and converting this into electricity through expansion and compression of a medium like Mercury. TED is neither an engine nor an electric motor, but utilises noble electrical and mechanical principles to produce energy that functions as power transmission to any application where energy can be driven by motive power without using fossil fuels.
How does TED work?
The apparatus includes a volumetric amplifier connected to a cylindrical container filled with liquid Mercury. A heat capsule attached to the Mercury mover receives heat energy from an external source and subsequently causes a change in temperature of such mover, which the device is able to record. The effective volume available within the Mercury mover being fixed, results in the movement of a purpose designed piston. This marks the completion of a semi stroke, and causes hydraulic fluid which is filled in the volumetric amplifier to flow to an associated hydraulic cylinder. This fluid flows through inlet/outlet ports of an amplifier, which results in the piston retracting. Subsequently, piston recedes from the Mercury mover chamber in response to the expansion of Mercury, followed by a return stroke wherein the said piston moves towards this chamber. This process of repeated full strokes results in a repetition of piston movements of the hydraulic cylinder and/or the volumetric amplifier. This process perpetuates, and a crankshaft which is connected to a gearbox causes a step-up/step-down depending on the requirements of flywheel shaft. However, as this shaft is connected to the generator, it causes movement of rotor and resultant electrical energy.
Benefits of Energy Device
Addressing global issues of depletion of fossil fuels has led to research in novel sources for clean fuel technologies. Undertaking efforts in field of renewable energy, Nanik Mulchandani has invented The Energy Device which can potentially be used as a means of providing an alternate fuel less rural transportation solution or as a device that has the capability to generate consistent green power. Added benefits include low construction and maintenance costs on account of its design.
media
-
![]()
Can Nuclear Power And Renewable Energy Learn To Get Along?
Nuclear power and variable renewable energy sources like wind and solar power “do not play well together.”
That is a commonly accepted nugget of wisdom these days. I heard the argument most recently during an interesting colloquy on Twitter this week with Fresh Energy CEO Michael Noble, reporter Matthias Krause, and author and editor of Renewables International Craig Morris.
If true, the idea that renewables and nuclear do not mix has important implications. It would mean that if we want to build an ultra-low carbon electricity system to confront climate change, we may face two mutually exclusive paths: one path dominated by nuclear energy (call it the French paradigm) and the other dominated by variable renewables (call it the German paradigm).
(In fact, supporters of the German Energiewende use this argument that large penetrations of renewables are incompatible with nuclear as one of the justifications for the nuclear phase-out underway there now). The more I think about this, however, the more I am convinced that the accepted wisdom that renewables and nuclear mix like oil and water is true only up to a point.
I begin with this basic point: In rough terms, once a variable source of renewable energy, such as wind or solar power, reaches an energy penetration level (measured as the share of total energy supply) equal to that source’s average capacity factor, aggregate output from that variable renewable energy source will routinely fluctuate between 0 and 100 percent of total electricity demand.
For example, if the average capacity factor of solar photovoltaic’s is 10 percent (about what it is in Germany), once solar PV reaches about 10 percent of the system-wide energy mix, solar output will vary from 100 percent of demand when producing at full capacity on a bright mid-summers day and 0 percent when night falls. Wind turbines in the breezy American Midwest have a capacity factor closer to 35-45 percent, so wind would reach a ceiling at about 40 percent of energy share in that region.
There are two important implications of reaching this:
First, without energy storage, high penetrations of renewables do not leave much room in the power system for nuclear power plants (or any other “base load” power plant). While nuclear reactors can technically “ramp” or vary output up and down to follow loads (albeit less flexibly than gas turbines), “cycling” or shutting down entirely and start up again later is too challenging for a nuclear plant to do routinely. Yet at high penetrations of variable renewables, every other plant on the system would have to be capable of routinely cycling on and off.Second, increasing the penetration of renewables beyond the point where energy share equals capacity factor would mean the renewable source would begin to regularly produce more electricity than demanded. Without storage or energy sinks willing to buy up excess power, renewable generators would then have to curtail a growing share of their output and waste any associated revenues.
In practice, this ceiling could actually be reached before renewable energy penetration equals capacity factor, as production would begin to regularly exceed demand on high output/low demand days long before this point.
In addition, if renewables are exposed to wholesale prices (and not subsidised outside the wholesale market, i.e. with feed-in tariffs), the market prices earned by renewables would be negatively correlated with their output. Wholesale prices are lowest precisely when renewable generators are all cranking out power (again, this assumes no energy storage/sinks). At some point, adding more renewables just would not be profitable any more. If renewables have to pay for the system balancing services and flexibility needs they contribute to, this economic limit is reached even earlier.This point where energy share = capacity factor is probably a generous ceiling for renewable energy penetration absent storage then.
If solar capacity factors typically range from 10-20 percent and wind from 25-45 percent, that makes it awfully hard to reach an ultra low carbon energy system powered principally by renewables. Once these sources reach a combined share of maybe 30-40 percent of the energy mix, technical and economic constraints will make it very hard to increase their share further.If we want to increase renewable penetration beyond these levels and drive truly deep de-carbonization of the power system, we therefore need massive amounts of new system flexibility to match demand with varying renewable energy output.
We would need electric batteries and thermal energy storage to shift output to when its needed, dynamic load shifting and demand response to align demand with output, and ‘energy sinks’ to make productive use of excess output.
But here is the kicker: if we have the massive amounts of storage and flexibility needed to achieve an ultra-low carbon electricity system dominated by variable renewables, we also have the storage and flexibility needed to make a hybrid nuclear-renewable power system feasible as well.With that kind of system flexibility, we could store energy and shift loads to avoid having to cycle off and on nuclear plants and limit their ramping only to when it’s the most economical way to provide system flexibility. Jesse Jenkins is a Graduate student and Researcher at the Massachusetts Institute of Technology.
Recommended resources
1. Joint Institute for Strategic Energy Analysis workshop reports: "Nuclear and Renewable Energy: Potential Synergies" 2. Ruth et al. "Nuclear-Renewable Hybrid Energy Systems: Opportunities, Interconnections, and Needs" Energy Conversion and Management 78 (2014): 684–694 3. MIT Energy Initiative symposium report: "Managing Large-scale Penetration of Intermittent Renewables" 4. Data on daily operations of French nuclear reactors (by reactor and in aggregate) showing load-following and flexible operation. 5. Electricite de France (EDF) technical presentation on flexible operation of nuclear reactors. 6. OECD/Nuclear Energy Agency white paper: "Nuclear Energy and Renewables: System Interaction Effects in Low-carbon Energy Systems" 7. Denholm et al. "Decarbonizing the electric sector: Combining renewable and nuclear energy using thermal storage," Energy Policy 44 (2012): 301-311 8. California Science and Technology Council report: "California's Energy Future: Portraits of Energy Systems for Meeting Greenhouse Gas Reduction Requirements" 9. National Renewable Energy Laboratory: "Renewable Energy Futures Study" 10. Fosberg, "Hybrid systems to address seasonal mismatches between electricity production and demand in nuclear renewable electrical grids," Energy Policy 62 (2013): 333–341. 11. Mills & Wiser: "Changes in the Economic Value of Variable Generation at High Penetration Levels: A Pilot Case Study of California," LBNL (2012). 12. International Electro technical Commission, "Grid-integration of large capacity Renewable Energy sources and use of large-capacity Electrical Energy Storage," IEC (2012).
media
-
![]()
Nuclear Power And Benefits In The Short Term
This article is the result of some very interesting discussions on the potential of coal, nuclear and wind/solar to supply the rapidly growing energy needs of the developing world. In that article, I estimated that nuclear is roughly an order of magnitude less scalable than coal, but more than double as scalable as wind/solar. These estimations were challenged by both nuclear and wind advocates and, as such critical discussions often do, have prompted much closer investigations into this issue. In particular, data pertaining to the near-term prospects of nuclear energy in China, the nation accounting for fully 43% of nuclear plants currently under construction, has been analysed in more detail.
The results of this analysis confirmed my estimations above fairly well, but only under two very important assumptions: 1) that all the nuclear plants currently under construction in China are successfully completed roughly 6 years after construction commenced and 2) that it will be a very long time before we experience another black swan event like Fukushima.
Recent nuclear developments in China China has invested heavily in nuclear energy over the past few years, leading to a rapid increase in construction activities. Data from the World Nuclear Association has allowed for the creation of the following plot of started and completed nuclear reactor capacity in China. Note that the plot shows the cumulative started and completed nuclear capacity from the start of 2007.
The graph shows a rapid increase in new nuclear construction projects from 2008 onwards when alternative energy investment really started to take off. In addition, a clear 18-month pause in new construction projects is visible starting from 2011, indicating the substantial impact of the Fukushima disaster on Chinese nuclear growth. However, the graph shows that new nuclear construction starts resumed an upwards trend from middle 2012, albeit significantly less aggressively than before Fukushima.
As can be expected, nuclear plant completions show a long time-lag relative to nuclear plant starts. Nuclear plant construction generally takes 4-6 years in China, but the trends in the graph suggest that the reality might lie towards the upper end of this range. In the event that a 6 year construction time is generally representative, it would seem that we are currently on the cusp of a rapid nuclear growth phase in China. Thus, if the next 2-3 years reveal that the blue curve above is essentially a 6-year time-shift of the red curve, it will bode well for the future of nuclear energy. If not, however, nuclear prospects would appear substantially dimmer, at least in the medium term. It will therefore be very interesting to extend this graph with real-world data over the next couple of years. Nuclear vs. wind
Wind power has also been growing rapidly in China since 2008. The relative simplicity and modular nature of wind causes much shorter construction times than nuclear, and has therefore led to a much more immediate impact. However, the true scalability of a technology must be tested over substantially longer time periods than the 6 year nuclear construction period, implying that this time-lag is not highly relevant when considering the longer-term energy future of China.
Under the assumption that wind construction times are essentially negligible, we can therefore compare the rate at which new investments are committed to wind and nuclear energy. To make this comparison, one also has to take into account the difference in capacity factors between wind and nuclear energy. This is a rather sensitive area, but I will use data from the BP Statistical Review and the World Nuclear Association to make a reasonable estimate. At the end of 2013, China had 15 GW of operational nuclear and 91 GW of operational wind. In terms of generation, nuclear delivered 110.6 TWh and wind 131.9 TWh. This implies that one unit of nuclear capacity delivers about 5 times as much electricity as one unit of wind capacity. This might be an over-estimate, however, since China is working hard to solve significant wind curtailment problems at present. I will therefore use a ratio of 4 in this analysis.
Using these assumptions, the Chinese wind capacity build out is compared against the Chinese nuclear construction starts in the graph below (note that wind capacity is divided by 4 in order to reflect actual electricity generation relative to nuclear). Similar to the graph above, numbers are presented from a base of 0 at the start of 2007.
It is shown that new nuclear projects were started at a tempo more than double the rate at which wind projects were completed before Fukushima and roughly at an equal rate when nuclear starts eventually recovered thereafter. This is a clear indication of the impact of a black swan event on the prospects of nuclear power, even in China. Thus, it can be theorized that nuclear scales roughly triple as fast as wind under normal circumstances, but at an equal rate when a recent black swan event burdens the industry with additional regulations. Hopefully, we will go some decades without another black swan event so that nuclear growth rates can return to pre-Fukushima levels and maintain (or even exceed) these rates for an extended period of time.
It should also be mentioned that the Chinese tariff system favours wind over nuclear by paying a fixed feed-in tariff of $83-100/MWh to wind and $70/MWh to nuclear. Another important factor to consider is the reduced value of wind relative to nuclear due to the variability of wind power. Wind power also requires expensive high voltage transmission networks to transport power from good wind locations to population centers, something which is creating substantial challenges. Thus, if the playing field were to be leveled, the difference between nuclear and wind scaling rates should increase substantially.
Another important factor to consider is the CO2 avoidance potential of nuclear vs. wind. Here, there are two important distinctions to be made. Firstly, nuclear plants have a very long lifetime relative to wind, implying that more CO2 will be avoided over the lifetime of the plant. Secondly, nuclear displaces base load generation (essentially 100% coal) while wind displaces load-following generation (includes some gas). Even though I cannot find any good data, it should be safe to say that a large amount of load-following is still done with coal in China. However, natural gas consumption is rising rapidly and the gas share of load-following generation should increase substantially over the lifetime of current wind plants.
When accounting for these two main factors, the CO2 avoidance potential over the lifetime of the nuclear and wind investments depicted in the figure above can be estimated. For the plant lifetime, 50 years is assumed for nuclear and 20 years for wind. In terms of CO2 intensity of displaced generation, nuclear is assumed to displace 0.9 tonCO2/MWh (coal) and wind 0.6 tonCO2/MWh (coal + gas).
It is clear from the graph above that, under these assumptions, investments in new nuclear plants will translate into much greater CO2 abatement than investments in new wind farms. This is due to the longer lifetimes and base load coal displacement capability of nuclear.
Nuclear vs. coal
If all nuclear plants currently under construction are successfully completed, China may well lead a much needed revival in nuclear energy. However, it is important to keep things in perspective by comparing to the rate at which fossil fuels like coal have scaled to fuel the economic miracle that took place in China over the past decade or two.In order to compare the scaling rates of nuclear and coal, projected nuclear power (under the assumption that all plants under construction are successfully completed) has been converted to primary energy using a capacity factor of 90% and a typical thermal plant efficiency of 40%. The graph below compares the potential scaling rates by comparing the projected increase in primary energy from nuclear over the next 6 years to the increase in primary energy from coal one decade ago (coal data from the BP Statistical Review). The graph is plotted from a base of 0 in 2013 for nuclear and 2003 for coal.
The graph shows that nuclear is projected to scale a little over an order of magnitude slower than coal did one decade ago before the impact of Fukushima and still slower thereafter. This result is especially significant given the fact that the Chinese economy more than doubles in size every decade. This implies that the Chinese economy is about double as capable of adding energy capacity today as it was in 2003.
Conclusion
This analysis has shown that the scaling rate estimations provided are fairly accurate under two important assumptions: 1) that all nuclear reactors currently under construction are completed 6 years after construction started and 2) that it will be a long time before we experience another nuclear black swan event like Fukushima.

media
-
![]()
Growth of Renewable Energy and Capacity Factors
FERC recently reported that in the first half of 2014 Renewable Power made up 55.7% of all new install power generation capacity. This increase of Renewable Power capacity has been recognized as a very promising trend towards substantially reducing future U.S. carbon emissions. The FERC report, however, is based on maximum 'design' power generation capacities and does not compare new installed power capacities based on actual operations or annual generation capacities based actual 'capacity factors'. By adjusting newly installed power generation technologies for state-of-art capacity factors, how will the mix or level of Renewables' power generation actually compare to Non-Renewable Coal, Natural Gas, Petroleum and Nuclear Power?
To answer this question we need to first review the recently published FERC data. Refer to the following Table 1. Data Source: FERC "Office of Energy Projections, Energy Infrastructure Projects" for June 2014. Originally derived Ventyx, an ABB Company, Velocity Suite data. Note: 'Total Renewables' excludes Coal, Natural Gas, Nuclear and Oil 'primary fuel(ed)' power generation. The Table 1 data clearly shows that 'Total Renewables' Power generation (design) capacity made up 28.5% of total new installed capacity in the 1st half of 2013. This Renewable power generation capacity was primarily supplied by new added Solar + Wind Power capacities. Total Renewables Power capacity appears to increase up to 55.7% of total new installed capacity for the 1st half of 2014; once again provided primarily by Solar + Wind Power. In the 1st halves of 2013 and 2014, Non-renewable Power capacity was primarily supplied by Natural Gas, and Coal (2013 only).
The problem with the published FERC data is that it is based on 'maximum design' capacities; valid for only relatively shorter periods of actual operation. In other words the FERC data only applies to periods of Power Generation (levels) on the order of hours or days for Solar & Wind Power, and not over the period of a given full-year. This longer term or full-year expected actual power generation capacity-performance is normally determined by applying what is commonly defined as 'capacity factors'. Since the wind does not blow (within maximum capacity generation levels) or the sun does no shine 24 hours/day and 365 days/year, the capacity factors or 'actual annual power (net) generation' divided by 'maximum design generation capacity' is normally much less than 100%. Even Nuclear, Coal and Natural Gas, which can operate up to 24 hours-365 days/year (for specific years), must be shutdown every couple-few years for 'routine maintenance/required upgrades'. These required routine maintenance/upgrades causes even these generally much more reliable (non-renewable and fully dis patchable power) generation sources to also have capacity factors somewhat less than 100%. Capacity factors of Coal, Nuclear and Natural Gas Power are normally many times greater than (non-dis patchable/variable) Solar and Wind Power. To illustrate the different capacity factors and impact on expected or actual annual power generation capacities for Renewables and Non-renewables, refer to the following Table 2:
Data: FERC data shown in above Table 1 and EIA AEO 2014 'capacity factors' (Table 1-Estimated Levelized Cost). Note: Natural Gas capacity factor based on 'baseload' operation needed to displace Coal, and Waste Heat/Other estimates are based on recent actual performance (EIA Monthly Capacity Factors).
The actual annual power generation of newly installed Renewable and Non-renewable capacities are significantly different than the originally reported FERC design capacities; as shown in Table 1. Table 2 shows that in the first half of 2013 total Renewables only provided 13.6% of total annual new power generation capacity. This level of Renewables was largely exceeded by Coal Power, and overwhelmingly by Natural Gas Power in 2013 (1st half). Table 2 also shows that Renewable actual power generation capacities increased up to 31.9% in 2014 (1st half). While this 2.3X increase in Renewable Power annual generation capacity is a very promising improvement trend, new Natural Gas Power installed annual generation capacity still dominates the overall-total generation mix at 68%.
Future Renewable Power Generation Projections - The EIA has been increasingly criticized for under estimating future growth in Renewable Power. Their latest projection (AEO 2014) only shows a 17% growth in total Renewable Power by 2030. Based on the EPA's new/proposed carbon regulations for new and existing power plants this latest EIA AEO 2014 Renewable Power projection is probably very low and needs updating in future years.
What many EIA Critics may not understand is why the EIA's projections are conservative (or low in this case). The EIA normally only includes existing or fully approved regulations and the associated impacts on future power generation projections. In the case of Renewable Power some of the most influential regulations (power generation variables) historically have been individual States' Renewable Power Standards (RPS), Wind Power Production Tax Credit, and Solar Power Net Energy Metering (NEM) subsidies. Those regulations in effect including the RPS and NEM have been routinely incorporated into EIA AEO projections. However, when changes are made, such as only a short-term extension or expiration of that, the EIA does not assume another or perpetual series of short-term subsidies will continue. In the case of expiring at the end of 2013, those projects deemed 'under construction' at year's end will still qualify for up to 10 years of subsidies. All of the 2014 (1sthalf) Wind Power installations most likely are included in this extension and still qualify for the maximum of 10 years of 2.3 cent/KWh subsidies.
Other unknowns or variables such as the EPA's newly proposed carbon standards for each individual State's existing Power Generation capacity emissions (lbs. carbon/MWh generation) is still highly uncertain until the numerous Court challenges are settled and all States develop their final compliance plans. The same level of uncertainty also may exist for Solar PV NEM returns, which are being challenged and debated in many States at this time. Once these and other issues are resolved with a reasonable level of certainty should we expect the EIA to update future AEO projections accordingly?
Future Impacts of Power Generation Capacity Factors - The combination of technology developments and innovations have significantly increased the capacity factors of all types of state-of-art power generation over the years. Wind Power for example has experienced a large increase of capacity factors from the low 20's percent in the 1980's to the mid-high 30's percent today. However, there is another very critical variable that can and does impact the level of power generation capacity factors: 'maintenance performance'. For example, when you visit or observe most large Wind Farmers around the U.S. (and other Developed Countries) have you noticed that on reasonably windy days it's rare to not observe 10-20% or sometimes more of the turbines idled and obviously not in operation. Why? The reason is likely due to shutdown-maintenance issues, or possibly lack of adequate (preventative) maintenance. Yes, unless all forms of power generation are routinely and properly maintained by their Operators, their capacity factors (and delivered annual power generation) can and will decline very significantly.
So, where's the evidence other than random observations that Renewable Power capacity factors are possibly not increasing as technology developments and innovations should be expected to support? For one credible example, refer to the EIA 'Electric Power Monthly'. This relatively new EIA data report shows that Wind and Solar PV capacity factors have been well below the projected state-of-art levels used in Table 2 (31% vs. 35% and 20% vs. 25% respectively for the overall average CY's 2008-13).
And, what is the solution to improving and increasing Renewable Power generation capacity factors and actual annual power generation in the future? Besides increasing the level of annually installed state-of-art Renewable Power (design) generation capacity and installing/connecting into efficient and 'smart' power grids, Owner-Operators need to (or be required to) ensure that existing generation capacity is properly and continuously maintained in the future, while possibly upgraded as new-improved technologies/innovations develop.
Authored by John Miller: Energy Consultant and Professional Engineer; reported by Nanik Tirath Mulchandani.